Ok, so this is probably my last post. The project was a lot of fun and a great learning experience. If you are interested in reading my final results check out the paper I wrote. If you are still interested to learn more about this kind of stuff, go check out my classmates at the cse190a website because some of their stuff is really quite impressive.
cya!
Sunday, March 18, 2007
Wednesday, March 14, 2007
Feature Vocabulary
In the previous post I commented that the interest point detection algorithm I created looked like it could detect vehicles all by itself. I created a simplistic feature point counting program which 'detected' a parking spot as empty if the number of interest points in the ROI was below an arbitrary threshold. The results were moderately good but nowhere near as good as I had expected.
Threshold (min # of interest pts):
1 __ %81
2 __ %82
3 __ %77
4 __ %74
5 __ %70
The next thing I focused on was the generation of a code book of car features--small image segments centered at each interest point. For each ROI, I scale the image so as to normalize the 'zoom' of each image feature. To save a little time and memory, I only keep one feature image for interest points which are within a 3 pixel range. I then save all feature images who's center lie within the current parking space ROI being examined, positive features to one set negative features to another. Here's an example of the resulting feature vocabulary from one occupied parking space:

Monday, March 5, 2007
Interest Point Detection
So the next stage of the project is to bring in vehicle feature detection to make the overall algorithm more robust. To this end, I read Agarwal and Roth's paper on "Learning a Sparse Representation for Object Detection" and it seemed like an excellent place to start.
The first thing I needed to do was implement interest point detection and test it out on some of my training data. Kristen was kind enough to give me a copy of her implementation of Förstner Corner detection. But like Kristen warned me, Förstner worked fine on the test image of a checkers board but it didn't pick much up in my training images (see below):

I then used OpenCV's Harris Corner detection and found it to be extremely good for my project (see below):

The interesting thing about this Harris Corner detection algorithm is that even without creating a database of vehicle features and a database of non-vehicle features and then using that to detect vehicles, the interest points themselves are actually very accurate at determining where a vehicle is. However, I'm still going to try and reproduce as much of Adarwal and Roth's research, time permitting ;-)
Tuesday, February 20, 2007
Poster

After working all night I finally finished the slide for the EUReKA conference. Here it is....
Monday, February 19, 2007
KNN Distance Metric Comparisons
I just finished running a comparison of K-nearest neighbor using euclidean distance and chi-squared (I've been using euclidean this whole time). And what do you know, using chi-squared distance got me consistently better results. Here's the results of the tests:
KNN (k=3)
Night Images:
Euclidean Distance:
Euclidean Distance:
Chi-Square 1

Euclidean 1

Chi-Square 2

Euclidean 2

Chi-Square 3

Euclidean 3

KNN (k=3)
Night Images:
Euclidean Distance:
- 92% accuracy, # test images = 41
- 85% accuracy, # test images = 41
- 87% accuracy, # test images = 41
- 85% accuracy, # test images = 41
- 90% accuracy, # test images = 41
- 92% accuracy, # test images = 41
- 90% accuracy, # test images = 41
- 90% accuracy, # test images = 41
- 90% accuracy, # test images = 41
- 95% accuracy, # test images = 41
Euclidean Distance:
- 75% accuracy, # test images = 41
- 76% accuracy, # test images = 41
- 81% accuracy, # test images = 41
- 76% accuracy, # test images = 41
- 84% accuracy, # test images = 41
- 77% accuracy, # test images = 41
- 84% accuracy, # test images = 41
- 85% accuracy, # test images = 41
- 78% accuracy, # test images = 41
- 85% accuracy, # test images = 41
Chi-Square 1

Euclidean 1

Chi-Square 2

Euclidean 2

Chi-Square 3

Euclidean 3

Viewing Night Results
Photobucket Album
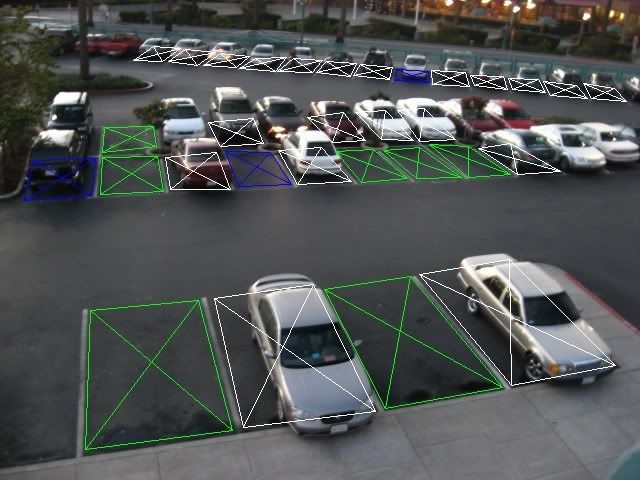
Green = empty space, White = occupied space, Blue = Misclassified Space
So I just finished writing a combination of programs which gather up the results from the k-fold validation testing and visualizes these results (ie creates a set of result pictures). You can go to my photo bucket account and view the results from the night set.
Wednesday, February 14, 2007
Night and Day
I have been gathering more training data and the increase from 650 total images to 740 has made a visible difference in the detection rates for the KNN classifier.
I have been experimenting with the idea of splitting the image set into smaller sets related to the time of day and general lighting level. Other than the benefits of reducing the KNN classification time, these time-specific images sets noticeably increase the detection rates. The following is results of my tests so far:
KNN (K=3)
All Images:
SVM
All Images:
I have been experimenting with the idea of splitting the image set into smaller sets related to the time of day and general lighting level. Other than the benefits of reducing the KNN classification time, these time-specific images sets noticeably increase the detection rates. The following is results of my tests so far:
KNN (K=3)
All Images:
- 79% accuracy, # test images = 148
- 80% accuracy, # test images = 147
- 84% accuracy, # test images = 148
- 78% accuracy, # test images = 148
- 78% accuracy, # test images = 149
- 80% accuracy, # test images = 107
- 83% accuracy, # test images = 107
- 66% accuracy, # test images = 106
- 82% accuracy, # test images = 107
- 78% accuracy, # test images = 109
- 90% accuracy, # test images = 41
- 90% accuracy, # test images = 41
- 90% accuracy, # test images = 41
- 82% accuracy, # test images = 41
- 80% accuracy, # test images = 41
SVM
All Images:
- 78% accuracy, # test images = 148
- 76% accuracy, # test images = 147
- 78% accuracy, # test images = 148
- 68% accuracy, # test images = 148
- 76% accuracy, # test images = 149
- 75% accuracy, # test images = 107
- 76% accuracy, # test images = 107
- 59% accuracy, # test images = 106
- 75% accuracy, # test images = 107
- 66% accuracy, # test images = 109
- 70% accuracy, # test images = 41
- 85% accuracy, # test images = 41
- 68% accuracy, # test images = 41
- 75% accuracy, # test images = 41
- 63% accuracy, # test images = 41
Subscribe to:
Posts (Atom)
