Ok, so this is probably my last post. The project was a lot of fun and a great learning experience. If you are interested in reading my final results check out the paper I wrote. If you are still interested to learn more about this kind of stuff, go check out my classmates at the cse190a website because some of their stuff is really quite impressive.
cya!
Sunday, March 18, 2007
Wednesday, March 14, 2007
Feature Vocabulary
In the previous post I commented that the interest point detection algorithm I created looked like it could detect vehicles all by itself. I created a simplistic feature point counting program which 'detected' a parking spot as empty if the number of interest points in the ROI was below an arbitrary threshold. The results were moderately good but nowhere near as good as I had expected.
Threshold (min # of interest pts):
1 __ %81
2 __ %82
3 __ %77
4 __ %74
5 __ %70
The next thing I focused on was the generation of a code book of car features--small image segments centered at each interest point. For each ROI, I scale the image so as to normalize the 'zoom' of each image feature. To save a little time and memory, I only keep one feature image for interest points which are within a 3 pixel range. I then save all feature images who's center lie within the current parking space ROI being examined, positive features to one set negative features to another. Here's an example of the resulting feature vocabulary from one occupied parking space:

Monday, March 5, 2007
Interest Point Detection
So the next stage of the project is to bring in vehicle feature detection to make the overall algorithm more robust. To this end, I read Agarwal and Roth's paper on "Learning a Sparse Representation for Object Detection" and it seemed like an excellent place to start.
The first thing I needed to do was implement interest point detection and test it out on some of my training data. Kristen was kind enough to give me a copy of her implementation of Förstner Corner detection. But like Kristen warned me, Förstner worked fine on the test image of a checkers board but it didn't pick much up in my training images (see below):

I then used OpenCV's Harris Corner detection and found it to be extremely good for my project (see below):

The interesting thing about this Harris Corner detection algorithm is that even without creating a database of vehicle features and a database of non-vehicle features and then using that to detect vehicles, the interest points themselves are actually very accurate at determining where a vehicle is. However, I'm still going to try and reproduce as much of Adarwal and Roth's research, time permitting ;-)
Tuesday, February 20, 2007
Poster

After working all night I finally finished the slide for the EUReKA conference. Here it is....
Monday, February 19, 2007
KNN Distance Metric Comparisons
I just finished running a comparison of K-nearest neighbor using euclidean distance and chi-squared (I've been using euclidean this whole time). And what do you know, using chi-squared distance got me consistently better results. Here's the results of the tests:
KNN (k=3)
Night Images:
Euclidean Distance:
Euclidean Distance:
Chi-Square 1

Euclidean 1

Chi-Square 2

Euclidean 2

Chi-Square 3

Euclidean 3

KNN (k=3)
Night Images:
Euclidean Distance:
- 92% accuracy, # test images = 41
- 85% accuracy, # test images = 41
- 87% accuracy, # test images = 41
- 85% accuracy, # test images = 41
- 90% accuracy, # test images = 41
- 92% accuracy, # test images = 41
- 90% accuracy, # test images = 41
- 90% accuracy, # test images = 41
- 90% accuracy, # test images = 41
- 95% accuracy, # test images = 41
Euclidean Distance:
- 75% accuracy, # test images = 41
- 76% accuracy, # test images = 41
- 81% accuracy, # test images = 41
- 76% accuracy, # test images = 41
- 84% accuracy, # test images = 41
- 77% accuracy, # test images = 41
- 84% accuracy, # test images = 41
- 85% accuracy, # test images = 41
- 78% accuracy, # test images = 41
- 85% accuracy, # test images = 41
Chi-Square 1

Euclidean 1

Chi-Square 2

Euclidean 2

Chi-Square 3

Euclidean 3

Viewing Night Results
Photobucket Album
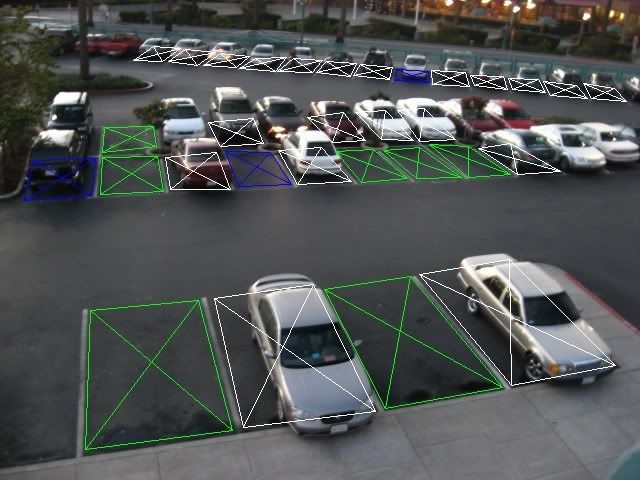
Green = empty space, White = occupied space, Blue = Misclassified Space
So I just finished writing a combination of programs which gather up the results from the k-fold validation testing and visualizes these results (ie creates a set of result pictures). You can go to my photo bucket account and view the results from the night set.
Wednesday, February 14, 2007
Night and Day
I have been gathering more training data and the increase from 650 total images to 740 has made a visible difference in the detection rates for the KNN classifier.
I have been experimenting with the idea of splitting the image set into smaller sets related to the time of day and general lighting level. Other than the benefits of reducing the KNN classification time, these time-specific images sets noticeably increase the detection rates. The following is results of my tests so far:
KNN (K=3)
All Images:
SVM
All Images:
I have been experimenting with the idea of splitting the image set into smaller sets related to the time of day and general lighting level. Other than the benefits of reducing the KNN classification time, these time-specific images sets noticeably increase the detection rates. The following is results of my tests so far:
KNN (K=3)
All Images:
- 79% accuracy, # test images = 148
- 80% accuracy, # test images = 147
- 84% accuracy, # test images = 148
- 78% accuracy, # test images = 148
- 78% accuracy, # test images = 149
- 80% accuracy, # test images = 107
- 83% accuracy, # test images = 107
- 66% accuracy, # test images = 106
- 82% accuracy, # test images = 107
- 78% accuracy, # test images = 109
- 90% accuracy, # test images = 41
- 90% accuracy, # test images = 41
- 90% accuracy, # test images = 41
- 82% accuracy, # test images = 41
- 80% accuracy, # test images = 41
SVM
All Images:
- 78% accuracy, # test images = 148
- 76% accuracy, # test images = 147
- 78% accuracy, # test images = 148
- 68% accuracy, # test images = 148
- 76% accuracy, # test images = 149
- 75% accuracy, # test images = 107
- 76% accuracy, # test images = 107
- 59% accuracy, # test images = 106
- 75% accuracy, # test images = 107
- 66% accuracy, # test images = 109
- 70% accuracy, # test images = 41
- 85% accuracy, # test images = 41
- 68% accuracy, # test images = 41
- 75% accuracy, # test images = 41
- 63% accuracy, # test images = 41
Monday, February 12, 2007
KNN > SVM
I just finished fixing my K-nearest neighbor program and what do you know, its detection rate is consistently better than the svm. The results on the k-fold cross-validation testing where k=5 is:
KNN
(K=1)
SVM
KNN
(K=1)
- 72% accuracy, # test images = 129
- 82% accuracy, # test images = 129
- 75% accuracy, # test images = 129
- 74% accuracy, # test images = 128
- 77% accuracy, # test images = 129
- 79% accuracy, # test images = 129
- 83% accuracy, # test images = 129
- 77% accuracy, # test images = 129
- 75% accuracy, # test images = 128
- 77% accuracy, # test images = 129
- 75% accuracy, # test images = 129
- 86% accuracy, # test images = 129
- 81% accuracy, # test images = 129
- 73% accuracy, # test images = 128
- 77% accuracy, # test images = 129
- 79% accuracy, # test images = 129
- 84% accuracy, # test images = 129
- 76% accuracy, # test images = 129
- 74% accuracy, # test images = 128
- 79% accuracy, # test images = 129
SVM
- 79% accuracy, # test images = 129
- 65% accuracy, # test images = 129
- 59% accuracy, # test images = 129
- 62% accuracy, # test images = 128
- 71% accuracy, # test images = 129
Cross-validation and KNN
Throughout the week I have been taking pictures of parking lots as I have walked to and from school each day. However, the number of ROI from my image set is still pretty small, around 650 distinct parking spaces, and this may be adversely affecting my training efforts. Most research papers that I've read have said that good results are often achieved with somewhere between 1000 and 2000 bits of training data.
The next thing that I did was to implement a cross-validation script. I ended up coding a K-fold in python which starts by randomizing the input data and then performs the cross validation. With K=5, the svm is classifying within a range of 59%-79% positive detection rate. This extremely wide range might be the result of poor randomization of the data on the part of the script and/or it might be due to the fact that I have very few night time images as part of my test data. Right now I'm going to increase the size of my test set and see if that has an effect in reducing the range of results returned by the cross-validation script.
The last thing that I worked on was to create a K-nearest neighbor classification program. I am still trying to debug the program but I hope to have it done sometime tonight or tomorrow.
Monday, February 5, 2007
SVMs
So I installed, trained, and ran SVMLight today. I used some images which weren't part of the training set and which were taken on completely different days than those taken for the training set (ie, no obviously similar images being used to train and test at the same time). However, these images were quite a bit larger than those that I trained on. I figure that because the features being used right now are color histograms and because this test was only to help me get my bearings, the difference in the sizes of the images wouldn't be extremely important for now. In the end, the SVM got 73% accuracy on the test set (58 pos detect, 21 neg detect), which I find encouraging for a first step.
One of the things I am considering doing next is relabeling my training set so that there are only non-occluded parking spaces being trained on. I also want to gather a more images to both increase the training set and also build a more realistic pseudo-test set. Lastly, I'm going to code up a program for visualizing the SVM's classification guesses overlaid on the test images if I have time.
One of the things I am considering doing next is relabeling my training set so that there are only non-occluded parking spaces being trained on. I also want to gather a more images to both increase the training set and also build a more realistic pseudo-test set. Lastly, I'm going to code up a program for visualizing the SVM's classification guesses overlaid on the test images if I have time.
Friday, February 2, 2007
Finished Histogramming
So I finally finished my color histogramming program. Since training the support vector machine is completely pointless unless the data you are training it on is accurate, I had to make sure that my 'histogrammer' was 100% bug free. Here are some of the test images I used to debug the program:
 Currently, the program works by reading in the log file which contains a list of coordinate-image lines to extract the pixels from a particular region of an image. For each line in the log file the program does the following:
My next step will be to train a support vector machine on this training data. Since I'm most familiar with SVMLight, I'm probably going to start there.
 Currently, the program works by reading in the log file which contains a list of coordinate-image lines to extract the pixels from a particular region of an image. For each line in the log file the program does the following:
- Compute the extraction region in the image.
- Convert the image from RGB to L*a*b*.
- Create 2 32-bin histograms, one for the 'a' channel and one for the 'b' channel (we discard the 'L' channel as it does not add much useful information in this case).
- Compute the histograms.
- Write out each histogram, bin by bin, to the resulting text file along with a 0 or a 1 to indicate if the region was a positive or negative training example.
My next step will be to train a support vector machine on this training data. Since I'm most familiar with SVMLight, I'm probably going to start there.
Monday, January 29, 2007
Histograms
So I talked to Tom Duerig about using SMORs as the cascade backbone for my the detection algorithm. Although I'll probably have to do a bunch of tweaking, it sounds like SMORs will work really well with this project.
I also talked to Carolina Galleguillos about how GroZi uses color histograms as part of the overall algorithm. She was kind enough to give me a copy of the histogram source file to help me get an idea of how to create my color histogramming program.
I ended up coding the histogramming program from scratch since the code from GroZi was not completely applicable. Currently I'm in the process of testing and debugging the program.
Lastly, I labeled my training images using the labeling program I created last week.
Monday, January 22, 2007
Color Histograms
I have been researching different methods for coming up with features from the sets of empty and occupied parking spaces before I create the program to gather these features. The most useful paper that I've found on this subject is called Color Photo Categorization Using Compressed Histograms and Support Vector Machines by Xia Feng, Jianzhong Fang and Guoping Qiu. This paper goes over a bunch of different methods for describing color information in images as well as their methodology for using a support vector machine for classification using the color features described in the previous section. It seems that the MPEG-7 color structure descriptor got the best results and this is what I'm going to read about this in more detail next (specifically, Color and Texture Descriptors by B. S. Manjunath, Jens-Rainer Ohm, Vinod V. Vasudevan, and Akio Yamada).
Sunday, January 21, 2007
Change of Direction
Due to some helpful advice I have refocused my research from car feature detection to the direct detection of vacant parking spaces. So far, the most promising work that I have found is by Qi Wu and Yi Zhang, two students at Carnegie Mellon. They're method for detecting the state (occupied/empty) of parking spaces centered around a SVM (Support Vector Machine) which was trained on the probability of the ground color. Overall, it sounds like they were pretty successful at creating a parking space detector. The one drawback to all of this is that this type of detector will only work well when there's very little occlusion by other vehicles due to a less than optimal camera angle. However, this seems like a good place to start and I think that using car feature detection in addition to this SVM-based detection algorithm could successfully deal with the cases where there's occlusion.

The first step towards implementing the SVM-based parking space detection algorithm is to extract the information from all of the parking spaces in the images in my training set. To this end, I have created a labeling program in Java which allows me to quickly label the parking spaces in the parking lot images and create a file log file of all of my label work. All one has to do is click on the 4 corners of a parking space and the program writes out the image path and coordinate information to the log file.
My next step will be to create a program to read the log file and quickly extract the set of pixels contained in each quadrangle. This way, I can label the pictures once, and extract the pixel info and create a set of parking space training features as many times as I want without having to relabel everything every time I make a change.
Tuesday, January 9, 2007
Battles With OpenCV and MS Visual Studio 2005
So I just loaded Microsoft Visual Studio 2005. The first time I tried to do this I failed because one of the installation CDs was warped! Thankfully the second set of install CDs was defect free. Next, I installed OpenCV and tried to integrate it into Visual Studios. I used qevanblog's blog to help guide me through the integration process. However, I think that the integration guide at sourceforge is a bit easier to understand. Of course OpenCV always loves to throw a curveball every now and again and it did so this time by complaining about missing DLLs (specifically highgui100.dll, cxcore100.dll, and libguide40.dll). My solution was to copy those DLLs to the directory of the executable I was building. I spent a bunch of time trying to have Visual Studios fold those DLLs into the executable as part of the build process but was unable to get that to work. Hopefully I will come up with a more practical solution in the near future.
EDIT:
I got some good advice from Thomas on how to fix my DLL problem. He suggested that I include the path to the directory that holds the DLLs in my environmental variables. Interestingly enough, when I went to go add the path to my environmental variables I found that it was already there. So I restarted Visual Studios, recompiled the test program and the thing actually worked. My guess is that my system was set up properly the whole time and I just did something stupid like not restarting or not reloading Visual Studios. Meh.
Wednesday, January 3, 2007

Monday, January 1, 2007
New Years Day training set

What better thing to do on New Years Day except for creating a training set of 45 new images. :-)
Subscribe to:
Posts (Atom)
